Increasingly, companies are looking to deploy "Business Intelligence" within their marketing and sales departments, using both internal and external data to define common objectives.
According to a study carried out by Ellisphere's Marketing & Sales Business Line, 86% of companies are using or planning to use big data to optimize their strategy.
Data collection must be comprehensive and integrated. This means that data must come from a variety of internal and external sources (CRM, ERP, social networks, etc.) and be consolidated in centralized systems or data management platforms. Integration enables a coherent and comprehensive view of information, essential for in-depth analysis.
What is Business Intelligence?
Business Intelligence (BI) encompasses a wide range of concepts, from process analysis to benchmarking. BI analyzes all the data created by a company to produce reports, dashboards and performance maps that can be used by departments to measure performance and trends for strategic decision-making.
To do this, it will be common practice to use advanced analytics tools such as business intelligence, machine learning, which in some companies can feed Artificial Intelligence through machine learning, and statistics, to extract insights from data. Advanced analytics can uncover hidden trends, opportunities and anomalies, facilitating more accurate predictions and more informed decisions.

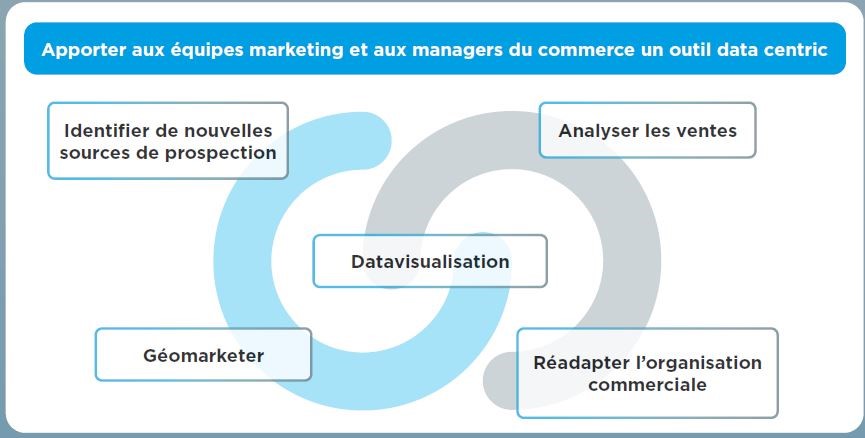
Why should marketers and managers exploit data?
It's a new approach to marketing and sales. It allows you to establish a data culture that will lead your company to become "data-centric".
The value of such an approach is well proven, as the data can be used to take companies' strategic approaches one step further.
The data-centric approach to marketing optimizes campaigns by integrating data at the heart of decision-making. It converts information into actionable insights for personalized, effective strategies aligned with consumer needs, maximizing return on investment.


Data collection must be comprehensive and integrated. This means that data comes from a variety of internal and external sources (CRM, ERP, social networks, etc.), and is consolidated in centralized systems or data management platforms. Integration enables a coherent and comprehensive view of information, essential for in-depth analysis.
Data must be accessible and understandable to decision-makers. The visualization tools found in some BI tools, such as dashboards and interactive reports, enable data to be presented in a clear and intuitive way. The aim is to make information usable at all levels of the organization, not just by data experts.
In the world of BI, how does Ellisphere help BtoB marketing and sales professionals?
To meet increasingly precise data needs, and sort through the mass of information potentially available internally (ERP, CRM, files, marketing automation tools...) and externally, the data engineers in Ellisphere's Marketing & Sales Business Line develop customized applications.
Our solutions that unite the strengths of marketing teams and sales managers
Connect to the market's leading BtoB database
Analytics by Ellisphere, 1 standard and 3 customizable versions
We offer 3 different versions of Analytics, depending on your needs, from a BI tool dedicated to marketing and sales managers to help them implement market actions and monitor sectors, to an ultra-customizable version right from the design stage.
Standard version: Analytics driving
Our BI application is designed for marketing and sales teams and their challenges in prospecting, market research and customer analysis... As well as guiding sales managers with information provided by marketing teams, to have shared KPI's to unite teams to achieve common goals.
Analytics driving will be fed with data both internal to your organization and external data supplied by Ellisphere :
Customer source data
Public source data
Source data Ellisphere
Version Analytics Business
Another marketing & sales approach: it is becoming increasingly common for certain structures to integrate an ABM (Account Based Marketing) strategy, to meet the need to identify the right contacts, and to provide marketing and sales elements and support.
In response to this challenge, Ellisphere has developed its business version.
It was through financial and economic data that our data engineers created Analytics Business.
Capital links enable us to identify whether a company belongs to another company or to a group of companies.
A group of companies is defined as an economic entity made up of a set of companies controlled by a single company (the group head, also known as the controlling company).
4 million business-to-business relationships
3 million separate shareholders
Every day, 800,000 links are updated by our experts using a multi-source approach.

If you're looking for a platform tailored to your needs and organization, our engineers can develop your Analytics according to your specifications.
Data, configurations, analysis reports, integration of the platform into your internal tools.... It's all possible.

Customized Analytics version

Every day, 800,000 links are updated in support of our multi-source strategy led by our experts.
The benefits for your in-house teams of having Analytics available in all versions
Contact us
Would you like to benefit from Ellisphere's expertise?
In accordance with the French Data Protection Act of January 6, 1978, as amended, you have the right to access, rectify, oppose, limit, withdraw your consent (if given), erase your data for legitimate reasons, and have your data ported. To exercise this right, please contact us by post at Ellisphere's head office at the following address: Tour Franklin - 100-101 Terrasse Boieldieu - 92042 Paris La Défense Cedex, or by e-mail at hotline@ellisphere.com. You may also lodge a complaint with the CNIL. For further information, please refer to our data protection policy.
