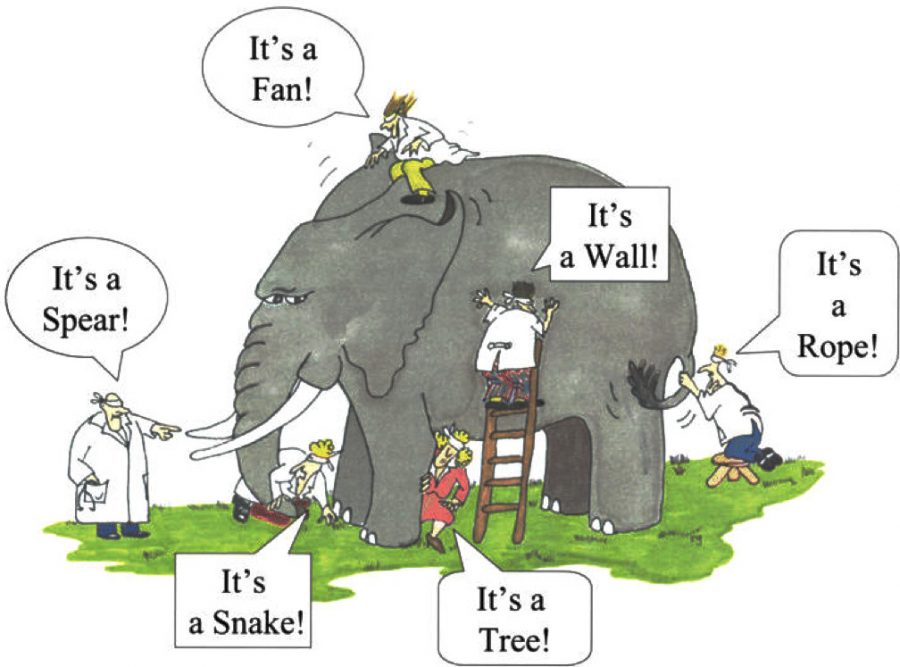
Experience shows that this is not enough. Moreover, regulators of financial institutions are not satisfied with knowing that a model can reduce the default rate on loans. What they want to know is why a specific decision was made.
So how do you get information from a model so that a non-technical user can assess the model's relevance?
A simple model
Logistic regression
The easiest way to provide a simple explanation to a third party is to use a model whose structure is itself easy to explain. Logistic regression is one of the first statistical models used. It is simple to design, is easy to optimize and does not require large computer resources.
A quick web search on logistic regression may lead the most mathematically allergic to think that the advertised simplicity of logistic regression is just a lure.
In fact, behind this convoluted mathematical expression lie some extremely accessible concepts. The core of logistic regression is a weighted sum such as the formula below. The x variables are the descriptive variables used in the model.
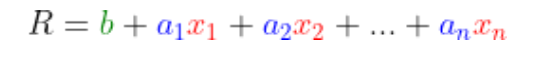

For example, it can be the characteristics of a house in a house price prediction model. The variables a and b are the coefficients of the model. It is the value of these variables that we will try to optimize so that R is as close as possible to the real price of the house, for all the houses we have in our database.
In this formula, R can take any value. In a logistic regression, R is passed through another mathematical formula, the logistic function, to make sure that R is between 0 and 1. To summarize, logistic regression is a weighted sum of descriptive variables, reduced to values between 0 and 1.
Titanic: an application model
Let's take as an example the dataset of choice for apprentice data scientists: the data on the passengers of the Titanic. In this famous tutorial, we try to identify the survivors of this terrible shipwreck. We will consider here a simple case using only the social class, the sex and the age of the passenger. Let's compare the predictions of our little model for the three protagonists of the famous 1999 movie.
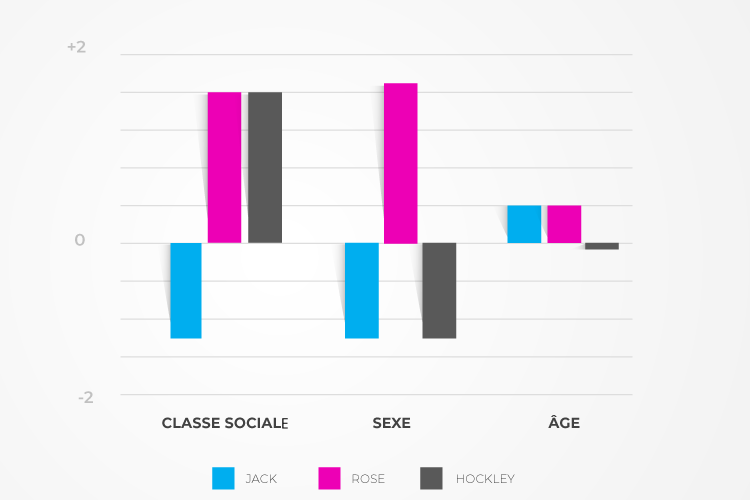

The hero of the film, Jack, is a third-class man. The model assigns a negative contribution to Jack's chances of survival to these characteristics. In contrast, Rose is a first-class woman and thus benefits from the famous adage "Women and children first" (the model is not trained to know that she will jump out of the boat at the last second).
Hockley, Rose's fiancé, does not have priority to board the lifeboats as a man. However, his status as a first-class passenger seems to improve his chances. Several scenes actually show first-class men in the boats, not just our antagonist.
The model thus shows consistency with our expectations: women and children first, first-class privileges, etc. Thus, although the model's parameters were optimized without any external "expertise", we can verify that its behavior is consistent with the expectations of the "experts". Through this work on explainability, we gain confidence in the model.
A technique to explain them all
When one wishes to use more complex models, the direct explicitation of the model as we have just done it is no longer possible. Many methods have been developed to try to identify the dominant elements of the result. The most popular method today is based on the Shapley value.
Shapley's value
In game theory, the Shapley value is used to determine how to distribute the gains from a collective activity "fairly" among the participants.
The example proposed in this explanatory video is based on a shared cab trip. Three people share a cab. The trip costs less than the sum of three individual trips. How can the "gain" from sharing a cab be distributed fairly? By allocating to each person the fraction of the gain corresponding to his or her Shapley value. This video (this time in French) proposes another case study.
Once a model becomes a bit complex, variables can have combined effects. In the previous model, the impact of class was identical regardless of gender. However, it is easy to imagine that the male/female difference in survival chances is much more pronounced in the third class than in the first. It then becomes difficult to estimate the contribution of each variable independently.
The Shapley value allows us to answer this problem. For a given person, we can calculate the chances of survival if we consider only a subset of the available characteristics.
For example, we can calculate the chances without considering the sex or the class of the person. We then repeat the operation for all the possible subsets.
By doing weighted averages of the survival odds (Shapley's method) for each subset, one is able to obtain the importance of each variable for that specific individual.
Businesses' understanding of data science techniques as a key to trust
One (rather popular) method has been detailed here. There are many others, sometimes specific to a domain (image analysis ...). Here, the details of a technique are less important than the why of the details.
It has already been mentioned that the confidence of business experts in AI systems depends in part on explicability. The business could be satisfied with the raw explanations provided by a given method.
However, explanatory models only give a biased picture of the reality of the model. For Shapley, for example, the contribution of each variable depends on the characteristics of our anonymous passenger.
It is therefore important that business experts have knowledge of the models used and their visualization techniques in order to collaborate more effectively in the creation of useful models.